6 Ways to Help Get Insights that Matter from Your Onsite Analytics
Analytic data has the potential to be a small business’s best friend, but only if the business owner knows how to interpret the data correctly and then use the findings to optimize his/her website. If this seems like an overwhelming task to you, you’re not alone. According to Inc. Magazine, the rule of analytics is “if you have $100 to spend on an analytics tool, spend $10 on the actual reports and data and $90 on someone who knows how to filter through that information and can teach you how to best use it.” That being said, instead of suggesting you pay someone else to interpret your data, we’re going to show you how to do it yourself, thus optimizing your budget and your website’s potential. But before we can do that, you need to understand the difference between onsite and offsite analytics.
Onsite vs. Offsite
The best way to describe the difference between onsite and offsite analytics is that offsite analytics describes the potential your website has for visitors, whereas onsite analytics measures the actual traffic that appears on your site. Offsite is the big picture that allows you to compare your site to others, and this data can be accessed by anyone and everyone who is interested in it. Onsite analytics refers to specific details like how many conversions your site has received, when people have abandoned the site, what pages they viewed, etc. and this data can only be accessed by the website owner and anyone he/she gives permission to. This article is going to focus on showing you how to get the most out of your onsite analytic data using the most popular tool, Google Analytics.
Google Analytics provides more than enough free data to help entrepreneurs get the most out of their business website, which is extremely important considering the research shows that a company’s website is their most powerful marketing tool. So take the time to learn how to interpret this beneficial data and cut some costs out of your analytics budget, all the while optimizing your site to increase conversions. Sounds like a win-win, right? All you need to do is follow these simple steps:
-
Use Page Tagging
Before you can use any type of analytics software, you must enable page tagging on all your web pages. Page tagging basically means leaving a small amount of code, or JAVA script, behind on each page so that it registers every time a visitor comes to your site. Without page tagging, Google Analytics has no way of tracking the traffic to your site. Read this article if you’re still confused about what page tagging is, why it’s important, or how to create it on your site.
-
Interpret Audience Data to Classify Your Visitors by Demographic
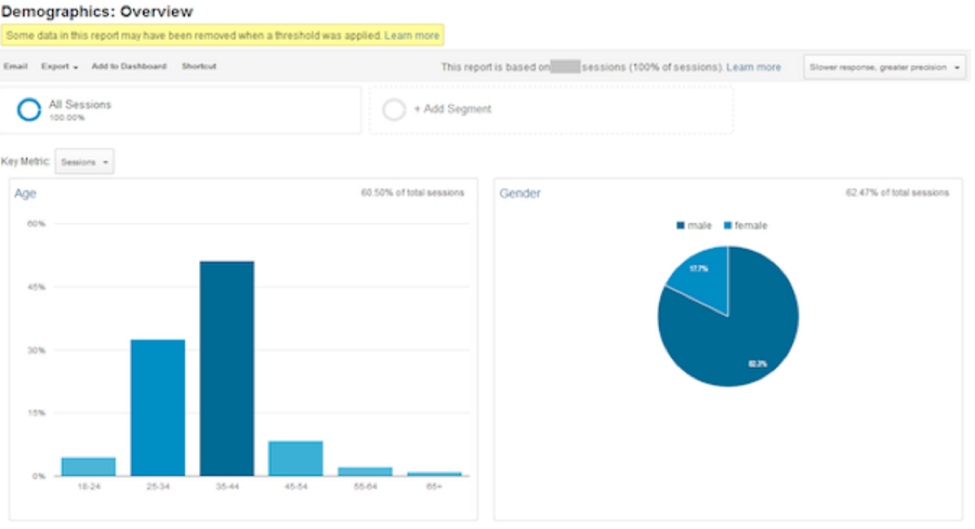
It’s just as important to figure out who your visitors are as it is to determine where they’re coming from. Classifying your site traffic by demographic can help you target your audience to optimize your marketing and remarketing campaigns. Use Google Analytics’ custom visitor segments option in order to determine the average age, gender, occupation, etc. of your audience and then use that to set and evaluate goals for your business. This article on Wordstream goes in depth on exactly how to create and interpret custom visitor segments.
-
Set Goals and Assign Them a Monetary Value
Setting goals may seem like a basic first step for any small business, but have you ever thought about assigning those goals a monetary value, even if it is a generic one? Goal setting is obviously important so you can see how your business is, or isn’t, growing and/or responding to your marketing campaigns, and assigning a dollar value to your goals will take your planning one step further. This is because although it may be easy to identify a downward trend in sales, if you don’t think of your conversions in terms of specific dollar values it’s very difficult to see exactly how much money you’re making or losing. It also makes it impossible to see the financial value of each individual page on your website in terms of conversion paths. Knowing your gains or losses in revenue is paramount to running a successful business, so start goal setting and take the extra time to allocate a monetary value to those goals. This article on truesocialmetrics.com explains exactly how to go about getting started.
-
Identify Your Conversion Paths and Figure Out Which Marketing Campaigns are the Most Successful
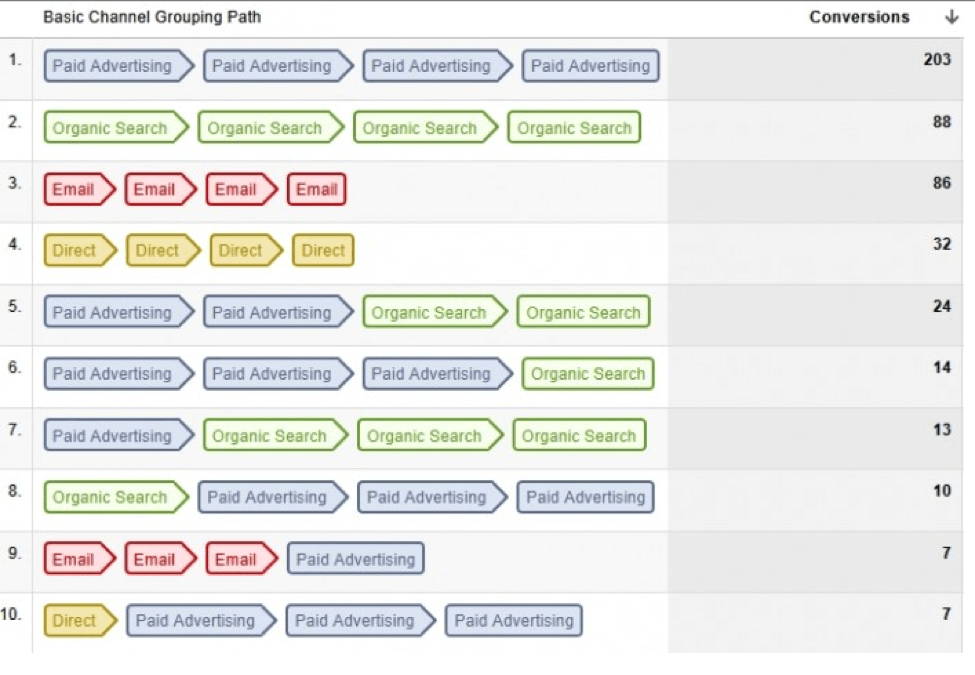
Image credit: switchedonagency.com
Setting goals and assigning them a value goes hand in hand with identifying the conversion paths on your website. You have to be able to do one in order to understand the other. If you’re going to take the time to set goals and try out different marketing campaigns, it would be a waste to not evaluate how those things are, or are not, working to create conversions. Google Analytics makes it very simple to track your conversion paths by offering a “top conversion paths” section in their reports. Just go to “Conversions > Multi-Channel Funnels > Top Conversion Paths” and easily see where your conversions are coming from. Then take it one step further and create advanced segments. This allows you to track your traffic from whatever domains interest you, and then see that traffic be immediately converted into analytic data that will show you exactly which marketing campaigns are the most lucrative.
-
Reduce Site Abandonment by Optimizing Exit Pages
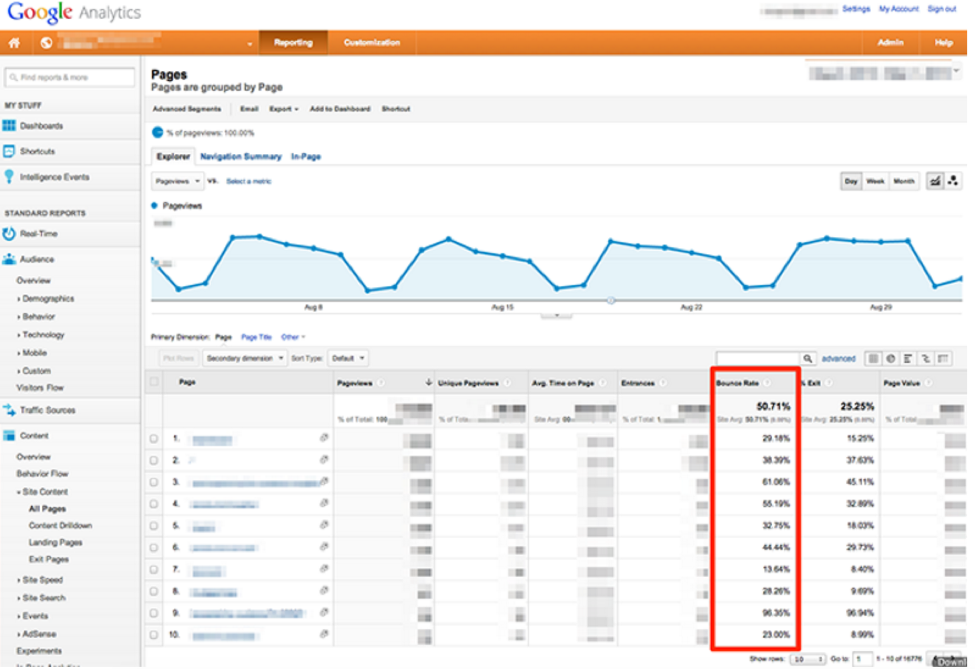
Image credit: qualaroo.com
You can do this by using Google Analytics behavior reports. Just go to “Behavior > Site Content > Exit Pages”. Your top exit pages will be listed in the main column. Then try to determine how these pages can be improved to decrease the chances that your visitors will leave your site immediately after accessing the pages in question. Some things to consider changing are: outdated content, errors, irrelevant links, or plugins. You could also consider adding an ad, an email signup, a link to the next relevant step, etc. Amy Lynn Andrews goes into more detail about how to optimize your exit pages on her blog here.
-
Make Sure Your Content is Relevant to Search Queries
Google’s search analytics report shows how often your site appears in Google’s search results. You can run this report and figure out where your traffic is coming from, how it’s changed over time, which queries came from mobile devices, and what searches are mostly going to result in a hit for your site. This article from Google Support shows you how to run the report and how to read the data in order to best determine how to target your marketing and content to optimize your web traffic.
Now it’s your turn to try! What beneficial things have you learned from experimenting with Google Analytics? Do you know any other helpful insights that can be gained by learning about this super helpful tool? Share your thoughts in the comments below!